ECG Arrhythmia Classification Using Discrete Wavelet Transform
Abstract
Cardiovascular diseases (CVDs) are the highest leading cause of death worldwide with an approximate 17.9 million related deaths every year according to the World Health Organization (WHO). Electrocardiographic (EKG or ECG) signals are electrical signals measured in the heart and are the main indicator for pre-existing cardiac conditions. The application of deep learning methods such as artificial neural networks (ANN) will assist in the automated detection and classification of ECG signals. The current methods for ECG analysis are lacking in accuracy and reliability considering the level of risk involved with CVDs and the importance of a correct diagnosis. Clinicians use ECG data to find irregular patterns that may indicate the existence of potentially life-threatening cardiac conditions. The proposed method uses the discrete wavelet transform for feature extraction and a feed-forward neural network for the classification of six types of heart beats. This approach achieves impressive results in terms of accuracy, sensitivity, and specificity across all classes. The best results obtained were 97.87%, 99.57%, and 97.87%, respectively. Although simpler than other state-of-the-art methods, this approach achieves competitive results and can help reduce the chance of misdiagnosis and missed diagnosis.
Our Approach
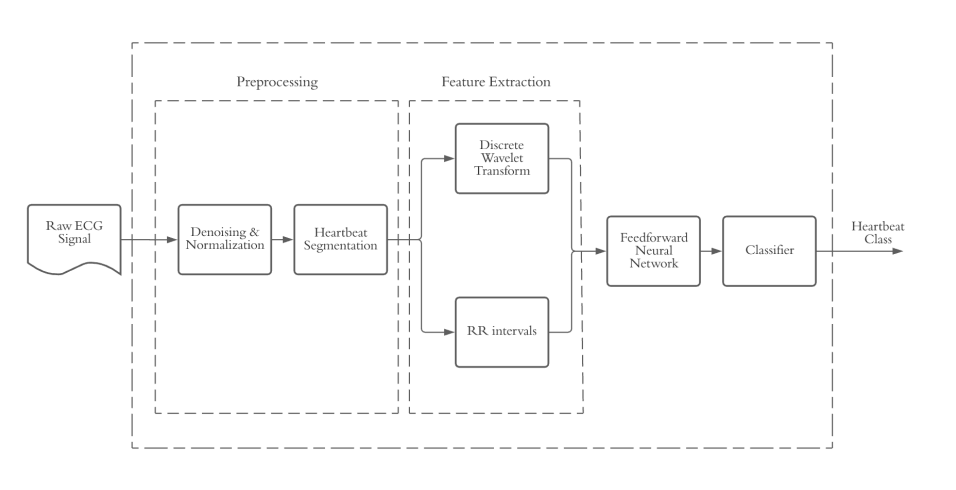
There are three major stages in any heartbeat classification system: preprocessing, feature extraction, and classification. The preprocessing stage is arguably the most important of the three as each subsequent stage relies on the quality and accuracy of the processed signal. As a result, before applying any analytical techniques on the signal it is important to normalize and filter out any unwanted noise from the signal. A typical ECG signal may contain many types of noise, the most significant of which are induced by baseline wander, powerline interference, muscular contractions (electromyography), and instrumentation noise. These interferences are known as signal artifacts and can seriously hinder the accuracy of a diagnosis. For this project, the preprocessing stage will first remove any unwanted powerline interference and electromyographic noise by passing the signal through a digital low pass filter at 30 Hz. A high pass filter will then be applied at 0.5 Hz to reduce baseline wander.
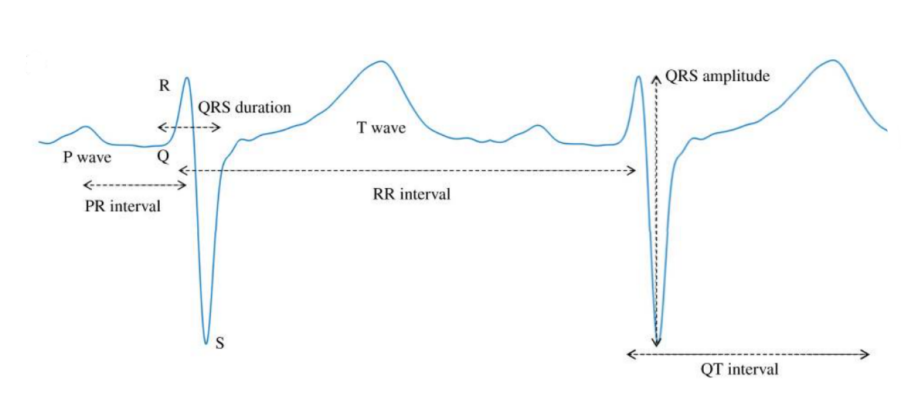
After the initial filters have been applied, the signal is segmented into individual beats. Next, the feature extraction of each beat takes place. Features refer to any notable morphological characteristics of a heart beat. These may include, but are not limited to the slopes, peaks, amplitudes, frequency, or anything that helps describe the shape of the ECG waveform. Although every heartbeat is slightly different, they all share the same morphological pattern. Every heartbeat is composed of a series of deflections away from the baseline of the ECG. A single beat of a sinus cycle may be divided into several different sections, the most significant of which, are namely the P-wave, QRS-complex, and T-wave [13]. A few popular features are illustrated below.

For this approach, features will be extracted using a wavelet transform. Feature quality and robustness has proven to be an obstacle in previous research. Poor feature extraction and filtering has proven to lead to a generally low performance system despite having powerful classification algorithms [14]. The wavelet transform, however, has been demonstrated as an effective tool for isolating relevant properties of an ECG waveform from lingering noise and other potentially impairing artifacts [2,3]. Previous studies have shown that using a down sampled wavelet transform as their feature set have demonstrated higher classification accuracies when compared to using the original waveform. A wavelet transformation is similar to a Fast-Fourier Transform (FFT) but provides a feature set describing a waveform in terms of both time and frequency. This allows for the representation of additional special features of a wavelet at multiple resolutions.

After a feature set is extracted from the signal it will be passed through a neural network classifier. The neural network will be trained and tested using feature sets as described above. Data will be used from the Massachusetts Institute of Technology-Beth Israel Hospital (MIT-BIH) ECG database, a publicly available database created in the late 1900s as a reference standard for ECG classification systems [16]. The classification stage is responsible for using a FNN with a common classification function to analyze and determine the irregularities found in the signal, or lack thereof. This step will solve multiple classification problems via logistic regression which will help determine the final diagnosis. In this approach, the classification stage will use a method called softmax. A softmax activation function, otherwise known as a normalized exponential function, is a non-linear logistic function generalized to multiple dimensions [17]. It is popularly used as the last activation function of a neural network due to its ability to reliably normalize the output of a network to a probability distribution over the given output classes. This makes the output of the classification stage extremely readable and easy to work with. It also allows the computer to easily determine the percentage confidence of the final diagnosis which is a very important factor when dealing with potentially life-threatening diseases.
Results
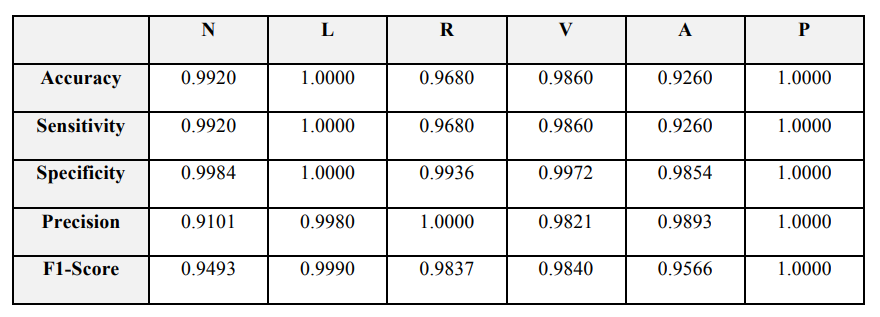
To evaluate the performance of the proposed model, a few widely used metrics were applied: accuracy, sensitivity, specificity, precision, and F1-score. Each metric is important for indicating different aspects of the model's performance. Accuracy is the most straightforward as it signifies the ratio between correctly classified heartbeats compared to the number of total heartbeats. However, for medical applications it is important to consider more than just accuracy as the datasets are typically imbalanced heavily in favor of “normal” behavior which can skew the weighting of the model. In the case of ECG classification, heart arrhythmias are rare, but can pose a serious threat to a patient's health, so it is crucial that a classification model can consistently classify outliers. For this reason, we have employed a few metrics to signify more niche information about specific classes. The sensitivity and specificity metrics are popular for medical applications as they determine the percent of samples in a class correctly predicted by the model, and the percent of samples correctly identified as negatives. The precision metric is best used when a dataset is imbalanced as it signifies the ratio between correct and incorrect classifications for every class. Finally, F1-score provides a combination of sensitivity and precision, making it a convenient tool for determining the overall effectiveness of the model on each class.

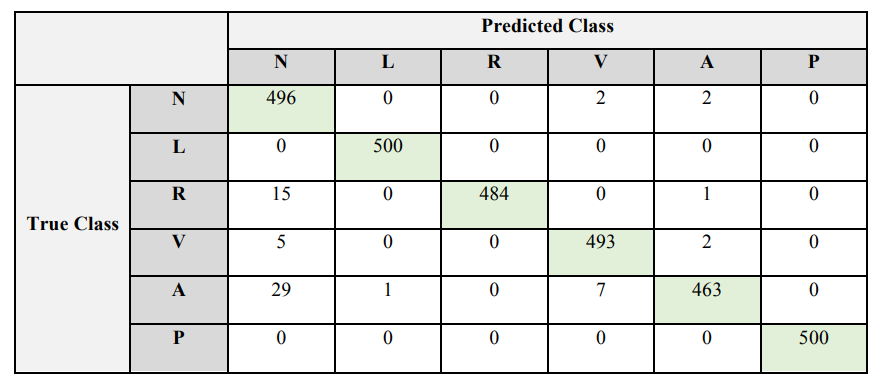
A confusion matrix is arguably the most effective visual to demonstrate the performance of a multi-class classification model. Accordingly, a confusion matrix was constructed for the training, validation, and testing data sets. Included below is the confusion matrix for the testing dataset. Each entry in the confusion matrix denotes the number of predictions made by the model, with the columns representing the expected result and the rows representing the predicted result. This visualization technique is effective for determining the accuracy of the model relative to each class and provides insight as to what classes the model is having trouble differentiating between.

The proposed method of ECG classification achieves results comparable with other methods discussed. The tables above provide the best representations regarding the performance of our system as it relates to our testing dataset. The proposed method achieved an overall accuracy of 98.67%, a specificity of 99.57%, and a sensitivity of 97.87%. However, it is important to evaluate each of these metrics on a class-by-class basis since the overall result has the potential to be inflated by the results of a single class. The results table provides insight on the results of each class. As expected, the paced beats achieved the highest scores since they often have the same morphological features across patients and are easy to differentiate from other classes. Atrial premature beat has the worst performance by a large margin with an accuracy, sensitivity, and specificity of 92.60%, 92.60%, and 98.54% respectively. This is likely due to the lack of data available for this arrhythmia compared to the other classes. During the preprocessing stage, the class distribution was somewhat normalized but there was still notably less representation for atrial premature beats in the datasets. That said, the classifier still provides a high classification rate for the class, and it provides a solid base for future improvements.